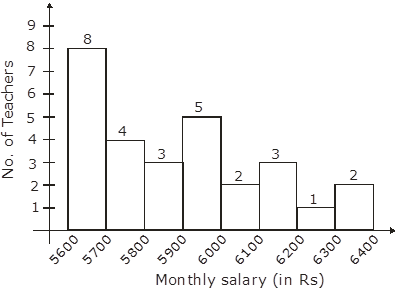
Draw a histogram to represent the following data :
Monthly salary (in Rs) | Number of teachers |
5600-5700 5700-5800 5800-5900 5900-6000 6000-6100 6100-6200 6200-6300 6300-6400 | 8 4 3 5 2 3 1 2 |
By drawing monthly salary on ‘x’ axis and numbers of teacher on ‘y’ axis.
7