The following histogram shows the number of literate females in the age group of 10 to 40 years in a town:
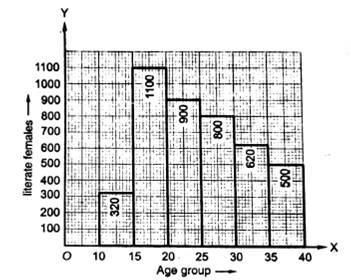
(i) Write the age group in which the number of literate female is the highest.
(ii) What is the class width?
(iii) What is the lowest frequency?
(iv) What are the class marks of the classes?
(v) In which age group literate females are the least?
(i) Age group 15-20 has the highest number of literate female.
(ii) Class width = 5 years
(iii) Lowest frequency = 320
(iv) Class marks of classes = average of class intervals = 17.5, 25, 32.5, 40, 47.5, 55
(v) Age group of 10-15 has the lowest literate females.
8