The following histogram shows the frequency distribution of the ages of 22 teachers in a school:
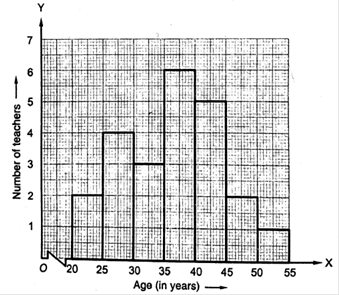
(i) What is the number of eldest and youngest teachers in the school?
(ii) Which age group teachers are more in the school and which least?
(iii) What is the size of the classes?
(iv) What are the class marks of the classes?
(i) The number of eldest teacher = 1
youngest teachers in the school = 2
(ii) 35-40 age group teachers are more in the school.
50-55 age group teachers are least.
(iii) Size of the classes = 5 years
(iv) Class marks of the classes = average of class intervals = 32.5, 40, 47.5, 55, 62.5, 70, 77.5
11