The weekly wages (in Rs.) of 30 workers in a factory are given:
830, 835, 890, 810, 835, 836, 869, 845, 898, 890, 820, 860, 832, 833, 855, 845, 804, 808, 812, 840, 885, 835, 835, 836, 878, 840, 868, 890, 806, 840
Mark a frequency table with intervals as 800-810, 810-820 and so on, using tally marks.
Also, draw a histogram and answer the following questions:
(i) Which group has the maximum number of workers?
(ii) How many workers earn Rs. 850 and more?
(iii) How many workers earn less then Rs, 850?
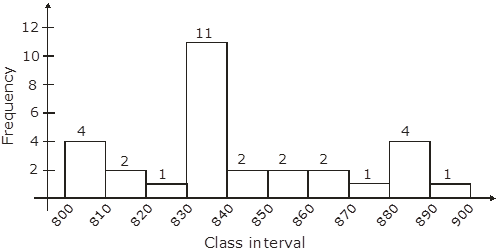
Class interval | Frequency |
800 – 810 | 4 |
810 – 820 | 2 |
820 – 830 | 1 |
830 – 840 | 11 |
840 – 850 | 2 |
850 – 860 | 2 |
860 – 870 | 2 |
870 – 880 | 1 |
880 – 890 | 4 |
890-900 | 1 |
(i) Group have maximum workers = ( 830 – 840 )
(ii) Workers have earning more than Rs.850 = 2+1+4+1+2 = 10
(iii) Worker earns less than Rs.850 = 4+2+1+11+2 = 20.
Histogram: by drawing class interval on ‘x’ axis and number of workers on ‘y’ axis.