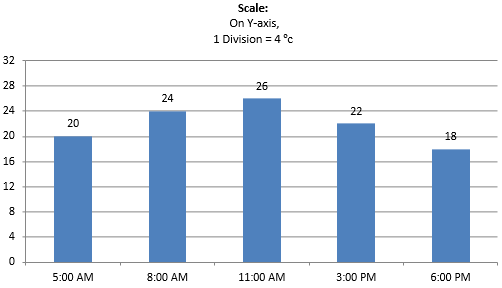
On a certain day, the temperature in a city was recorded as under:
Time | 5 a.m. | 8 a.m. | 11 a.m. | 3 p.m. | 6 p.m. |
Temperature (in °C) | 20 | 24 | 26 | 22 | 18 |
Illustrate the data by a bar graph.
2
On a certain day, the temperature in a city was recorded as under:
Time | 5 a.m. | 8 a.m. | 11 a.m. | 3 p.m. | 6 p.m. |
Temperature (in °C) | 20 | 24 | 26 | 22 | 18 |
Illustrate the data by a bar graph.