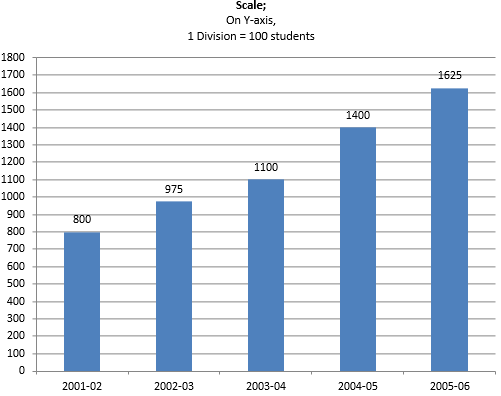
Given below is a table which shows the year wise strength of a school. Represent this data by a bar graph.
Year | 2001-02 | 2002-03 | 2003-04 | 2004-05 | 2005-06 |
No. of students | 800 | 975 | 1100 | 1400 | 1625 |
5
Given below is a table which shows the year wise strength of a school. Represent this data by a bar graph.
Year | 2001-02 | 2002-03 | 2003-04 | 2004-05 | 2005-06 |
No. of students | 800 | 975 | 1100 | 1400 | 1625 |