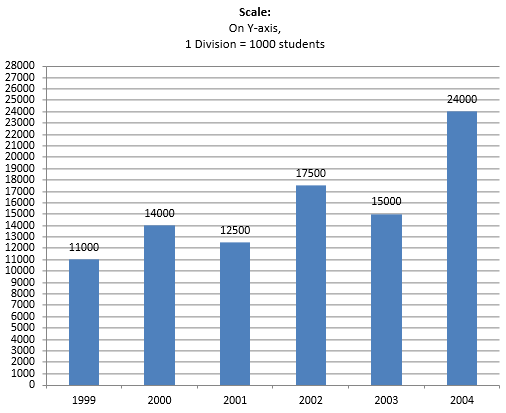
The following table shows the number of scooters produced by a company during six consecutive years. Draw a bar graph to represent this data.
Year | 1999 | 2000 | 2001 | 2002 | 2003 | 2004 |
No. of students | 11000 | 14000 | 12500 | 17500 | 15000 | 24000 |
6
The following table shows the number of scooters produced by a company during six consecutive years. Draw a bar graph to represent this data.
Year | 1999 | 2000 | 2001 | 2002 | 2003 | 2004 |
No. of students | 11000 | 14000 | 12500 | 17500 | 15000 | 24000 |