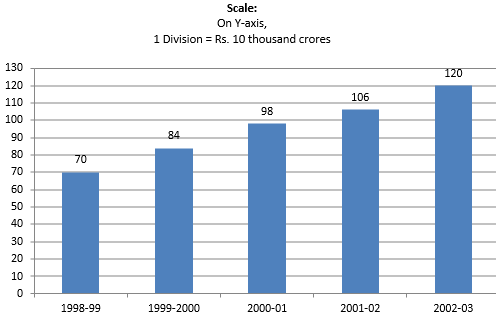
The following table shows the interest paid by India (in thousand crore rupees) on external debts during the period 1998-99 to 2002-03. Represent the data by a bar graph.
Year | 1998-99 | 1999-2000 | 2000-01 | 2001-02 | 2002-03 |
Interest (in thousand crore rupees) | 70 | 84 | 98 | 106 | 120 |
8