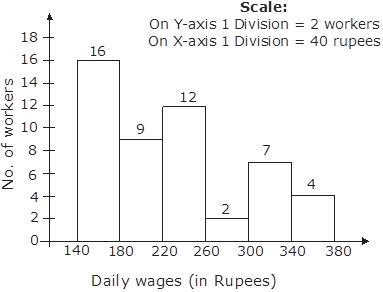
The daily wages of 50 workers in a factory are given below:
Daily wages (in rupees) | 140-180 | 180-220 | 220-260 | 260-300 | 300-340 | 340-380 |
Number of workers | 16 | 9 | 12 | 2 | 7 | 4 |
Construct a histogram to represent the above frequency distribution.
The given frequency distribution is in exclusive form, we will represent the class intervals along the X-axis and the corresponding frequency on the Y axis.
Now take the scale of,
1 big division = 40 rupees on X-axis,
1 big division = 2 workers on Y axis
We will draw the rectangles with the class intervals as basis and the corresponding frequency as the height.
Thus, we get the following histogram.
1