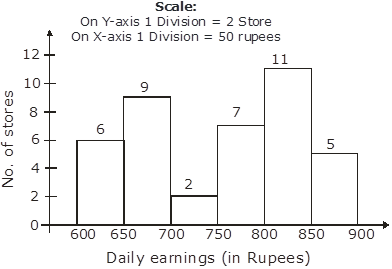
The following table shows the average daily earnings of 40 general stores in a market, during a certain week.
Daily earnings (in rupees) | 600-650 | 650-700 | 700-750 | 750-800 | 800-850 | 850-900 |
Number of stores | 6 | 9 | 2 | 7 | 11 | 5 |
Draw a histogram to represent the above data.
The given frequency distribution is in exclusive form, we will represent the class intervals along the X-axis and the corresponding frequency on the Y axis.
Now take the scale of,
1 big division = 50 rupees on X-axis,
1 big division = 1 store on Y axis
We will draw the rectangles with the class intervals as basis and the corresponding frequency as the height.
Thus, we get the following histogram.
2