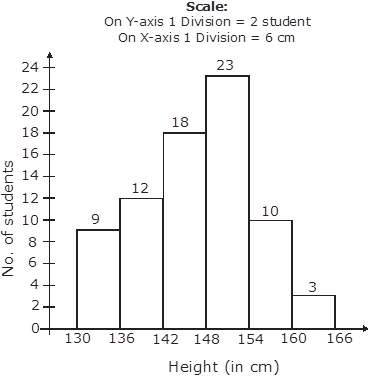
The heights of 75 students in a school are given below:
Height (in cm) | 130-136 | 136-142 | 142-148 | 148-154 | 154-160 | 160-166 |
Number of students | 9 | 12 | 18 | 23 | 10 | 3 |
Draw a histogram to represent the above data.
The given frequency distribution is in exclusive form, we will represent the class intervals along the X-axis and the corresponding frequency on the Y axis.
Now take the scale of,
1 big division = 6cm on X-axis,
1 big division = 2 students on Y axis
We will draw the rectangles with the class intervals as basis and the corresponding frequency as the height.
Thus, we get the following histogram.
3