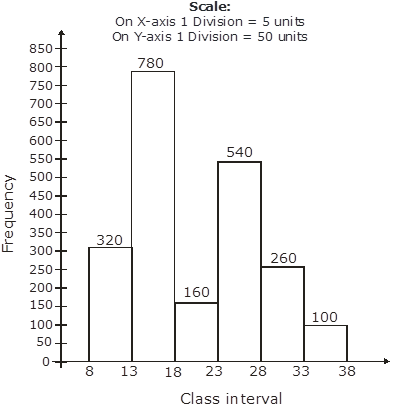
Draw a histogram for the frequency distribution of the following data.
Class interval | 8-13 | 13-18 | 18-23 | 23-28 | 28-33 | 33-38 | 38-43 |
Frequency | 320 | 780 | 160 | 540 | 260 | 100 | 80 |
The given frequency distribution is in exclusive form, we will represent the class intervals along the X-axis and the corresponding frequency on the Y axis.
Now take the scale of,
1 big division = 5 units on X-axis,
1 big division = 50 units on Y axis
We will draw the rectangles with the class intervals as basis and the corresponding frequency as the height.
Thus, we get the following histogram.
4