Construct a histogram for the following frequency distribution.
Class interval | 5-12 | 13-20 | 21-28 | 29-36 | 37-44 | 45-52 |
Frequency | 6 | 15 | 24 | 18 | 4 | 9 |
The given frequency distribution is in inclusive form. So, convert it in Exclusive form.
Class interval | Frequency |
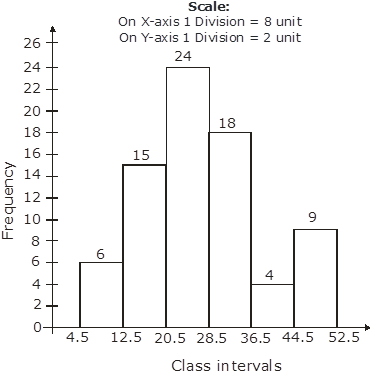
4.5-12.5 | 6 |
12.5-20.5 | 15 |
20.5 – 28.5 | 24 |
28.5 – 36.5 | 18 |
36.5 – 44.5 | 4 |
44.5 – 52.5 | 9 |
We will represent the class intervals along the X-axis and the corresponding frequency on the Y axis.
Now take the scale of,
1 big division = 8 units on X-axis,
1 big division = 2 units on Y axis
We will draw the rectangles with the class intervals as basis and the corresponding frequency as the height.
Now, we get following Histogram:
5