The following table shows the number of illiterate persons in the age group (10-58 years) in a town:
Age group (in years) | 10-16 | 17-23 | 24-30 | 31-37 | 38-44 | 45-51 | 52-58 |
Number of illiterate persons | 175 | 325 | 100 | 150 | 250 | 400 | 525 |
Draw a histogram to represent the above data.
We will represent the class intervals along the X-axis and the corresponding frequency on the Y axis.
Now take the scale of,
1 big division = 7 years on X-axis,
1 big division = 50 person on Y axis
We will draw the rectangles with the class intervals as basis and the corresponding frequency as the height.
The given frequency distribution is in inclusive form. So, convert it in Exclusive form.
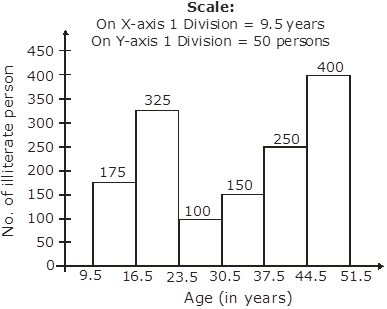
Age (in years) | No. of illiterate person |
9.5 – 16.5 | 175 |
16.5 – 23.5 | 325 |
23.5 – 30.5 | 100 |
30.5 – 37.5 | 150 |
37.5 – 44.5 | 250 |
44.5 – 51.5 | 400 |
51.5 – 58.5 | 525 |
Histogram as shown below: