Draw a histogram to represent the following data.
Class interval | 10-14 | 14-20 | 20-32 | 32-52 | 52-80 |
Frequency | 5 | 6 | 9 | 25 | 21 |
In the given frequency distribution, Class sizes are different.
So, we calculate adjusted frequency for each class, As, minimum class size = 4
Adjusted frequency of a class = ![]()
Class interval | Frequency | Adjusted Frequency |
10 – 14 | 5 |
|
14 – 20 | 6 |
|
20 – 32 | 9 |
|
32 – 52 | 25 |
|
52 – 80 | 21 |
|
Histogram is as follows:
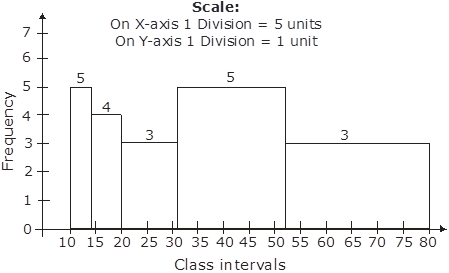
7