In a study of diabetic patients in a village, the following observations were noted.
Age in years | 10-20 | 20-30 | 30-40 | 40-50 | 50-60 | 60-70 |
Number of patients | 2 | 5 | 12 | 19 | 9 | 4 |
Represent the above data by a frequency polygon.
Let’s take two classes interval, first at beginning (0-10) and second at the end (70-80) each with frequency zero.
Now we can draw the frequency table with the help of these two classes,
Age in years | Class marks | Frequency |
0-10 | 5 | 0 |
10-20 | 15 | 2 |
20-30 | 25 | 5 |
30-40 | 35 | 12 |
40-50 | 45 | 19 |
50-60 | 55 | 9 |
60-70 | 65 | 4 |
70-80 | 75 | 0 |
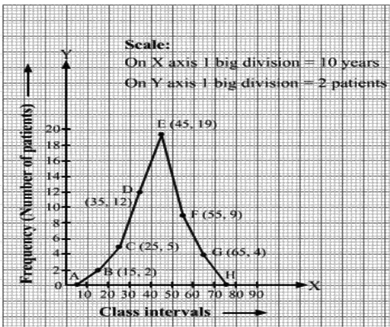
Now plot the following points on the graph,
A (5,0)
B (15,2)
C (25, 5)
D (35, 12)
E (45, 19)
F (55, 9)
G (65, 4)
H (75,0)
Join the points with line segments
AB, BC, CD, DE, EF, FG, GH, to obtain required frequency polygon. As shown in the figure.
8