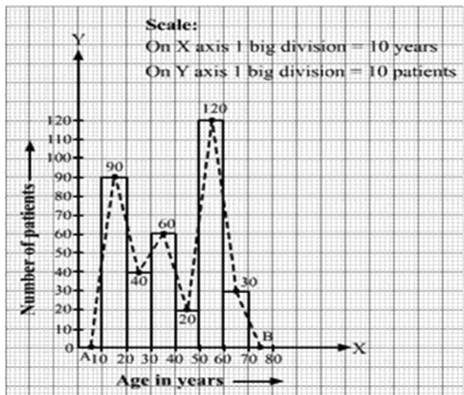
The ages (in years) of 360 patience treated in a hospital on a particular day are given below.
Age in years | 10-20 | 20-30 | 30-40 | 40-50 | 50-60 | 60-70 |
Number of patients | 90 | 40 | 60 | 20 | 120 | 30 |
Draw a histogram and a frequency polygon on the same graph to represent the above data.
We take imagined class 0 – 10 and 70 – 80, each with frequency zero. The class marks of above classes are 5 and 75 respectively.
So, we plot the points A (5,0) and B (75,0). We join A with the midpoint of the top of the first rectangle and B with the mid-point of the last rectangle.
Thus we obtain a complete frequency polygon,
9