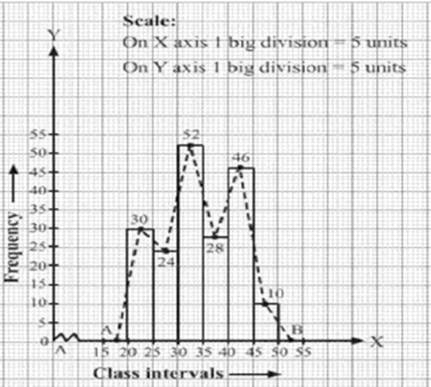
Draw a histogram and the frequency polygon from the following data.
Class interval | 20-25 | 25-30 | 30-35 | 35-40 | 40-45 | 45-50 |
Frequency | 30 | 24 | 52 | 28 | 46 | 10 |
We take imagined class 15-20and 0-55, each with frequency 0. The class marks of above classes are 17.5 and 52.5 respectively.
So, we plot the points A (17.5, 0) and B (52.5, 0). We join A with the midpoint of the top of the first rectangle and B with the mid-point of the last rectangle.
Thus we obtain a complete frequency polygon,
10