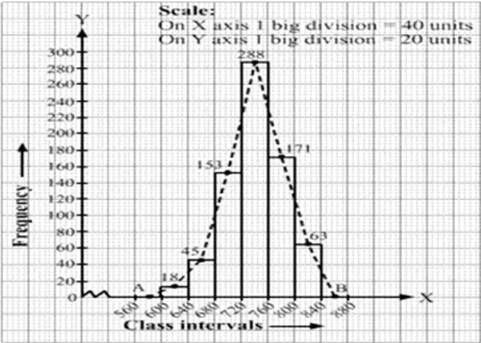
Draw a histogram for the following data:
Class interval | 600-640 | 640-680 | 680-720 | 720-760 | 760-800 | 800-840 |
Frequency | 18 | 45 | 153 | 288 | 171 | 63 |
Using this histogram, draw the frequency polygon on the same graph.
We take imagined class 560-600 and 840-880, each with frequency 0. The class marks of above classes are 5 and 75 respectively.
As we can see in the figure the x-axis starts at 560, a break is indicated near the origin to show that the graph is drawn with a scale beginning at 560, not at origin.
So, we plot the points A (580, 0) and B (860, 0). We join A with the midpoint of the top of the first rectangle and B with the mid-point of the last rectangle.
Thus we obtain a complete frequency polygon,
11