Draw a frequency polygon for the following frequency distribution.
Class interval | 1-10 | 11-20 | 21-30 | 31-40 | 41-50 | 51-60 |
Frequency | 8 | 3 | 6 | 12 | 2 | 7 |
We take the imagined classes (-9, 0) at the beginning and (61-70) at the end, each of the frequency 0.
Thus we have,
Class interval | Class marks | Frequency |
-9 – 0 | -4.5 | 0 |
1 – 10 | 5.5 | 8 |
11 – 20 | 15.5 | 3 |
21 – 30 | 25.5 | 6 |
31 – 40 | 35.5 | 12 |
41 – 50 | 45.5 | 2 |
51 – 60 | 55.5 | 7 |
61 – 70 | 65.5 | 0 |
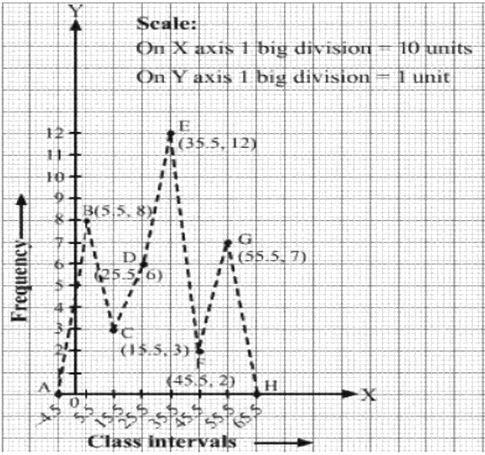
We plot the following points on the graph,
A (-4.5, 0)
B (5.5, 8)
C (15.5, 3)
D (25.5, 6)
E (35.5, 12)
F (45.5, 2)
G (55.5, 7)
H (65.5, 0)
Now we draw the line segment AB, BC, CD, DE, EF, FG, GH, to obtain the frequency polygon.
12