Draw the graph of the function A = x2.
The given function is A=x2 .
For some different values of x, the corresponding values of A are given below:
x | 0 | 1 | 2 |
A | 0 | 1 | 4 |
Now let us plot the points, O(0,0), S(1,1) and P(2,4).
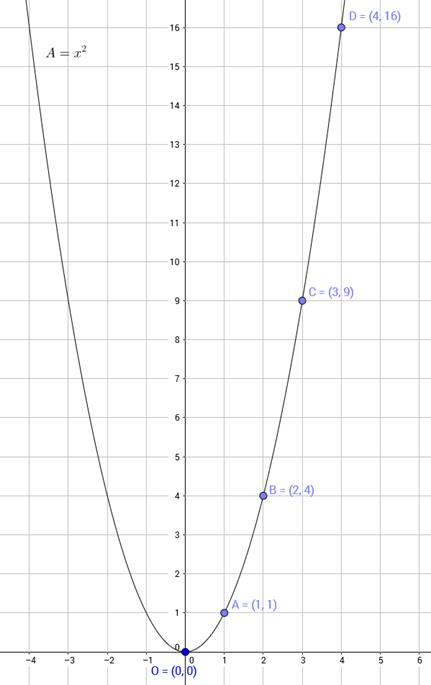
∴ Now we obtain the required graph.
3