Determine the mean of the following distribution

Here, we observe that, 5 students have scored marks below 10, i.e. it lies between class Interval 0 - 10 and 9 students have scored marks below 20.
So, (9 – 5) = 4 students lie in the class interval 10 - 20. Continuing in the same manner, we get the complete frequency distribution table for given data.
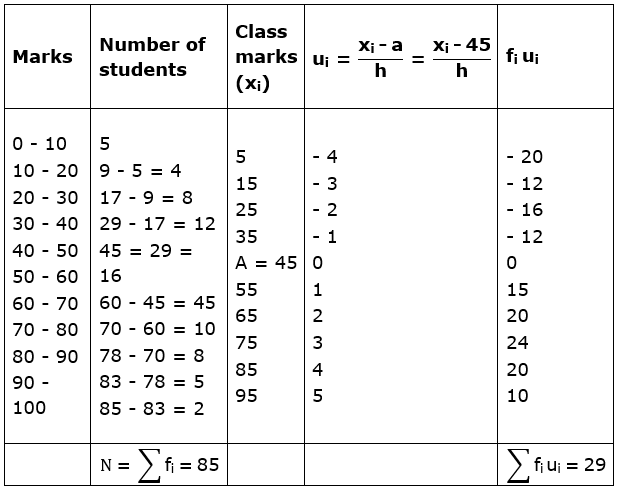
Here, (assumed mean) , a = 45
and (class width) h = 10
By step deviation method,
![]()
![]()
2