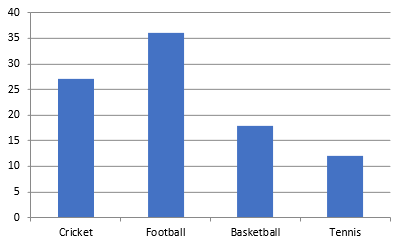
The following table shows the number of students participating in the various games in a school:
Games | Cricket | Football | Basket ball | Tennis |
No. Of students | 27 | 36 | 18 | 12 |
Draw a bar graph to represent the above data.
To draw the bar graph,
On x-axis take the games and on y-axis take the no. of students.
Now draw the bar graph;
7