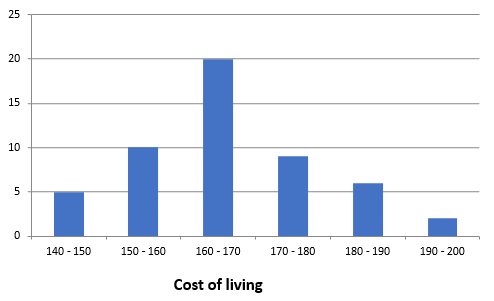
In the city, the weekly observations made on the cost of living index are given below.
Cost of living index | Number of weeks |
140-160 | 5 |
150-160 | 10 |
160-170 | 20 |
170-180 | 9 |
180-190 | 6 |
190-200 | 2 |
Represent the above information in the form of a histogram.
Draw the histogram with the help of given data.
17