The monthly consumption of electricity (in units) of some families of a locality is given in the following frequency distribution:
Monthly consumption (in units) | 140 - 160 | 160 - 180 | 180 - 200 | 200 - 220 | 220 - 240 | 240 - 260 | 260 - 280 |
Number of families | 3 | 8 | 15 | 40 | 50 | 30 | 10 |
Prepare a 'more than type' ogive for the given frequency distribution.
The frequency distribution table for ‘more than’ type is:
HEIGHT(cm) | CUMULATIVE FREQUENCY (Cf) |
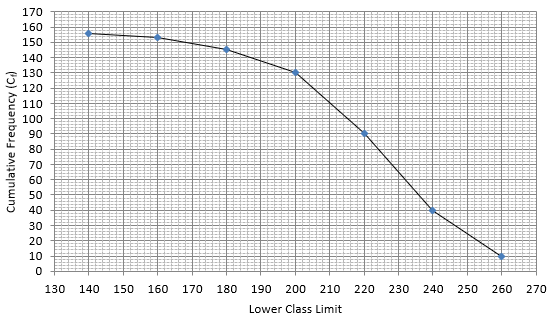
more than 140 | 153 + 3 = 156 |
more than 160 | 145 + 8 = 153 |
more than 180 | 130 + 15 = 145 |
more than 200 | 90 + 40 = 130 |
more than 220 | 40 + 50 = 90 |
more than 240 | 10 + 30 = 40 |
more than 260 | 10 |
Lets plot a graph of ‘more than’ ogive, taking lower limits of the class intervals on x - axis and cumulative frequencies on y - axis.
5