The table given below shows the weekly expenditures on food of some households in a locality.
Weekly expenditure (in Rs.) | Number of households |
100 - 200 | 5 |
200 - 300 | 6 |
300 - 400 | 11 |
400 - 500 | 13 |
500 - 600 | 5 |
600 - 700 | 4 |
700 - 800 | 3 |
800 - 900 | 2 |
Draw a 'less than type ogive' and a 'more than type ogive' for this distribution.
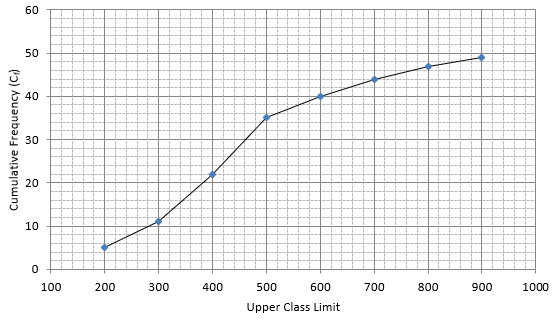
The frequency distribution table for ‘less than’ type is:
MARKS | CUMULATIVE FREQUENCY (Cf) |
Less than 200 | 5 |
Less than 300 | 5 + 6 = 11 |
Less than 400 | 11 + 11 = 22 |
Less than 500 | 22 + 13 = 35 |
Less than 600 | 35 + 5 = 40 |
Less than 700 | 40 + 4 = 44 |
Less than 800 | 44 + 3 = 47 |
Less than 900 | 47 + 2 = 49 |
Lets plot the graph of ‘less than ogive’, taking upper limits of the class intervals on x - axis and cumulative frequencies on y - axis.
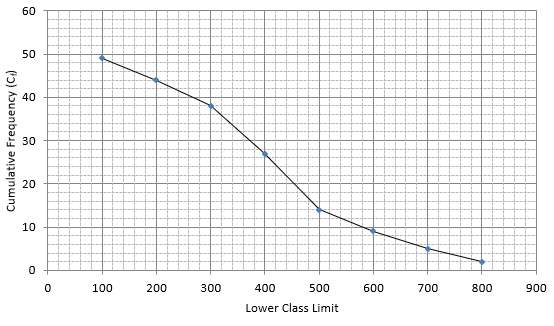
The frequency distribution table for ‘more than’ type is:
MARKS | CUMULATIVE FREQUENCY (Cf) |
more than 100 | 44 + 5 = 49 |
more than 200 | 38 + 6 = 44 |
more than 300 | 27 + 11 = 38 |
more than 400 | 14 + 13 = 27 |
more than 500 | 9 + 5 = 14 |
more than 600 | 5 + 4 = 9 |
more than 700 | 2 + 3 = 5 |
more than 800 | 2 |
Lets plot a graph of ‘more than’ ogive, taking lower limits of the class intervals on x - axis and cumulative frequencies on y - axis.