From the following frequency distribution, prepare the 'more than' ogive.
Score | Number of candidates |
400 - 450 | 20 |
450 - 500 | 35 |
500 - 550 | 40 |
550 - 600 | 32 |
600 - 650 | 24 |
650 - 700 | 27 |
700 - 750 | 18 |
750 - 800 | 34 |
Total | 230 |
Also, find the median.
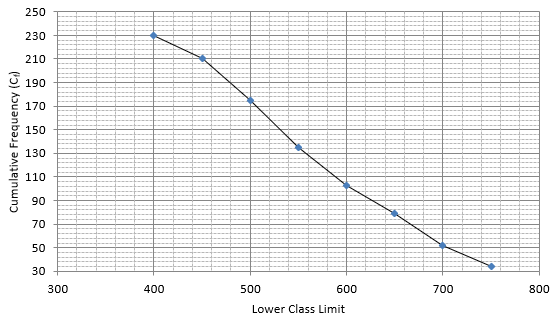
The frequency distribution table for ‘more than’ type is:
HEIGHT(cm) | CUMULATIVE FREQUENCY (Cf) |
more than 400 | 210 + 20 = 230 |
more than 450 | 175 + 35 = 210 |
more than 500 | 135 + 40 = 175 |
more than 550 | 103 + 32 = 135 |
more than 600 | 79 + 24 = 103 |
more than 650 | 52 + 27 = 79 |
more than 700 | 34 + 18 = 52 |
More than 750 | 34 |
Lets plot a graph of ‘more than’ ogive, taking lower limits of the class intervals on x - axis and cumulative frequencies on y - axis.
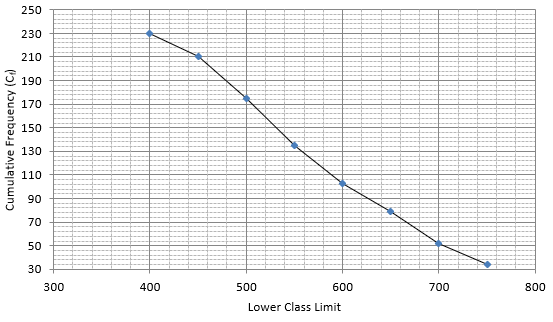
As we have N = 230 by the frequency table.
N/2 = 230/2 = 115
Mark 115 on y - axis and the corresponding point on x - axis would be the median.
![]()
![]() The corresponding point on x - axis is 590.
The corresponding point on x - axis is 590.
Hence, median is 590.