The marks obtained by 100 students of a class in an examination are given below:
Marks | Number of students |
0 - 5 | 2 |
5 - 10 | 5 |
10 - 15 | 6 |
15 - 20 | 8 |
20 - 25 | 10 |
25 - 30 | 25 |
30 - 35 | 20 |
35 - 40 | 18 |
40 - 45 | 4 |
45 - 50 | 2 |
Draw cumulative frequency curves by using (i) 'less than' series and (ii) 'more than' series.
Hence, find the median.
(i) The frequency distribution table for ‘less than’ type is:
MARKS | CUMULATIVE FREQUENCY (Cf) |
Less than 5 | 2 |
Less than 10 | 2 + 5 = 7 |
Less than 15 | 7 + 6 = 13 |
Less than 20 | 13 + 8 = 21 |
Less than 25 | 21 + 10 = 31 |
Less than 30 | 31 + 25 = 56 |
Less than 35 | 56 + 20 = 76 |
Less than 40 | 76 + 18 = 94 |
Less than 45 | 94 + 4 = 98 |
Less than 50 | 98 + 2 = 100 |
(ii) The frequency distribution table for ‘more than’ type is:
MARKS | CUMULATIVE FREQUENCY (Cf) |
More than 0 | 98 + 2 = 100 |
More than 5 | 93 + 5 = 98 |
More than 10 | 87 + 6 = 93 |
More than 15 | 79 + 8 = 87 |
More than 20 | 69 + 10 = 79 |
More than 25 | 44 + 25 = 69 |
More than 30 | 24 + 20 = 44 |
More than 35 | 6 + 18 = 24 |
More than 40 | 2 + 4 = 6 |
More than 45 | 2 |
Plotting points for ‘less - than ogive’ and ‘more - than ogive’ on the graph,
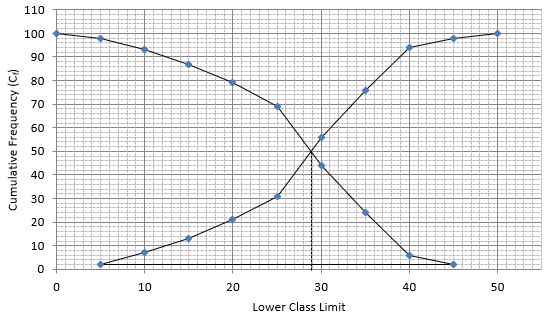
In this type of graph where ‘less than ogive’ and more than ogive’ are plotted in the same graph, median is found on x - axis by the intersection of these two ogives.
Here, median = 29.5