From the following data, draw the two types of cumulative frequency curves and determine the median.
Height (in cm) | Frequency |
140 - 144 | 3 |
144 - 148 | 9 |
148 - 152 | 24 |
152 - 156 | 31 |
156 - 160 | 42 |
160 - 164 | 64 |
164 - 168 | 75 |
168 - 172 | 82 |
172 - 176 | 86 |
176 - 180 | 34 |
(i) The frequency distribution table for ‘less than’ type is:
MARKS | CUMULATIVE FREQUENCY (Cf) |
Less than 144 | 3 |
Less than 148 | 3 + 9 = 12 |
Less than 152 | 12 + 24 = 36 |
Less than 156 | 36 + 31 = 67 |
Less than 160 | 67 + 42 = 109 |
Less than 164 | 109 + 64 = 173 |
Less than 168 | 173 + 75 = 248 |
Less than 172 | 248 + 82 = 330 |
Less than 176 | 330 + 86 = 416 |
Less than 180 | 416 + 34 = 450 |
(ii) The frequency distribution table for ‘more than’ type is:
MARKS | CUMULATIVE FREQUENCY (Cf) |
More than 140 | 447 + 3 = 450 |
More than 144 | 438 + 9 = 447 |
More than 148 | 414 + 24 = 438 |
More than 152 | 383 + 31 = 414 |
More than 156 | 341 + 42 = 383 |
More than 160 | 277 + 64 = 341 |
More than 164 | 202 + 75 = 277 |
More than 168 | 120 + 82 = 202 |
More than 172 | 34 + 86 = 120 |
More than 176 | 34 |
Plotting points for ‘less - than ogive’ and ‘more - than ogive’ on the graph,
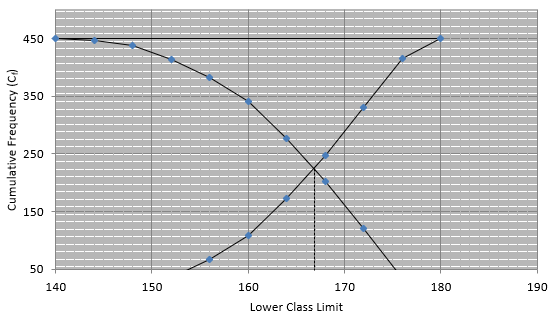
In this type of graph where ‘less than ogive’ and more than ogive’ are plotted in the same graph, median is found on x - axis by the intersection of these two ogives.
Here, median = 166