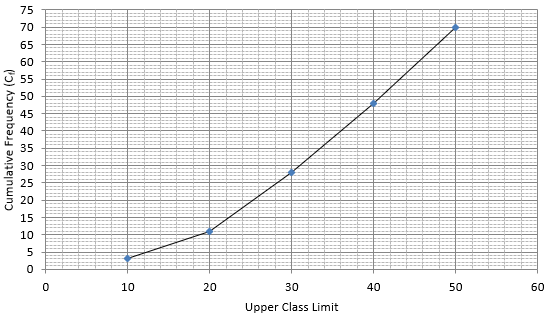
Following is the distribution of marks of 70 students in a periodical test:
Marks | Less than 10 | Less than 20 | Less than 30 | Less than 40 | Less than 50 |
Number of students | 3 | 11 | 28 | 48 | 70 |
Draw a cumulative frequency curve for the above data.
The frequency distribution table for ‘less than’ type is:
MARKS | CUMULATIVE FREQUENCY (Cf) |
Less than 10 | 3 |
Less than 20 | 11 |
Less than 30 | 28 |
Less than 40 | 48 |
Less than 50 | 70 |
Lets plot a graph of ‘less than ogive’, taking upper limits of the class intervals on x - axis and cumulative frequencies on y - axis.
13