Draw 'less than ogive' and 'more than ogive' on a single graph paper and hence find the median of the following data:
Class | 5 - 10 | 10 - 15 | 15 - 20 | 20 - 25 | 25 - 30 | 30 - 35 | 35 - 40 |
Frequency | 2 | 12 | 2 | 4 | 3 | 4 | 3 |
The frequency distribution table for ‘less than’ type is:
CLASS | CUMULATIVE FREQUENCY (Cf) |
Less than 10 | 2 |
Less than 15 | 2 + 12 = 14 |
Less than 20 | 14 + 2 = 26 |
Less than 25 | 26 + 4 = 30 |
Less than 30 | 30 + 3 = 33 |
Less than 35 | 33 + 4 = 37 |
Less than 40 | 37 + 3 = 40 |
The frequency distribution table for ‘more than’ type is:
CLASS | CUMULATIVE FREQUENCY (Cf) |
More than 5 | 28 + 2 = 30 |
More than 10 | 16 + 12 = 28 |
More than 15 | 14 + 2 = 16 |
More than 20 | 10 + 4 = 14 |
More than 25 | 7 + 3 = 10 |
More than 30 | 3 + 4 = 7 |
More than 35 | 3 |
Plotting points for ‘less - than ogive’ and ‘more - than ogive’ on the graph,
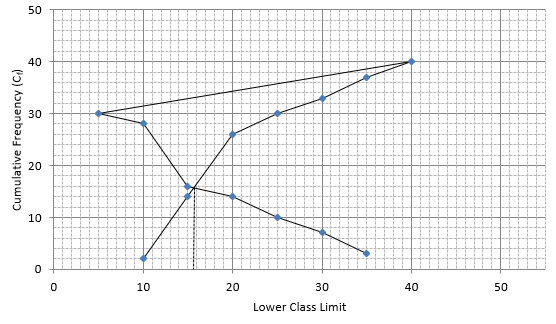
In this type of graph where ‘less than ogive’ and more than ogive’ are plotted in the same graph, median is found on x - axis by the intersection of these two ogives.
Here, median = 15.5