The production yield per hectare of wheat of some farms of a village are given in the following table:
Production yield (in kg/ha) | 40 - 45 | 45 - 50 | 50 - 55 | 55 - 60 | 60 - 65 | 65 - 70 | 70 - 75 | 75 - 80 | 80 - 85 |
Number of farms | 1 | 9 | 15 | 18 | 40 | 26 | 16 | 14 | 10 |
Draw a less than type ogive and a more than type ogive for this data.
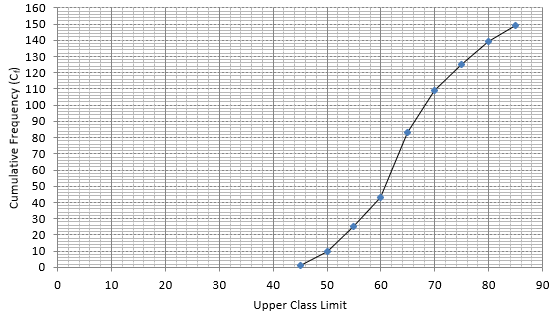
The frequency distribution table for ‘less than’ type is:
PRODUCTION YIELD (in kg/ha) | CUMULATIVE FREQUENCY (Cf) |
Less than 45 | 1 |
Less than 50 | 1 + 9 = 10 |
Less than 55 | 10 + 15 = 25 |
Less than 60 | 25 + 18 = 43 |
Less than 65 | 43 + 40 = 83 |
Less than 70 | 83 + 26 = 109 |
Less than 75 | 109 + 16 = 125 |
Less than 80 | 125 + 14 = 139 |
Less than 85 | 139 + 10 = 149 |
Lets plot the graph of ‘less than ogive’, taking upper limits of the class intervals on x - axis and cumulative frequencies on y - axis.
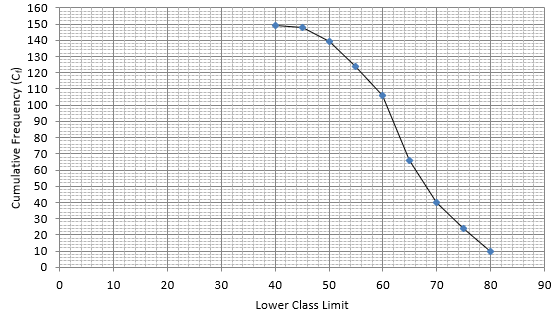
The frequency distribution table for ‘more than’ type is:
MARKS | CUMULATIVE FREQUENCY (Cf) |
more than 40 | 148 + 1 = 149 |
more than 45 | 139 + 9 = 148 |
more than 50 | 124 + 15 = 139 |
more than 55 | 106 + 18 = 124 |
more than 60 | 66 + 40 = 106 |
more than 65 | 40 + 26 = 66 |
more than 70 | 24 + 16 = 40 |
more than 75 | 10 + 14 = 24 |
more than 80 | 10 |
Lets plot a graph of ‘more than’ ogive, taking lower limits of the class intervals on x - axis and cumulative frequencies on y - axis.