Vapour pressures of pure acetone and chloroform at 328 K are 741.8 mm Hg and 632.8 mm Hg respectively. Assuming that they form ideal solution over the entire range of composition, plot ptotal, pchloroform, and pacetoneas a function of xacetone. The experimental data observed for different compositions of mixture is:
100 xacetone | 0 | 3.4.8 | 23.4 | 36.0 | 50.8 | 58.2 | 64.5 | 72.1 | |
pacetone /mm Hg | 0 | 54.9 | 110.1 | 202.4 | 322.7 | 405.9 | 454.1 | 521.1 | |
pchloroform /mm Hg | 632.8 | 548.1 | 469.4 | 359.7 | 257.7 | 193.6 | 161.2 | 120.7 |
Plot this data also on the same graph paper. Indicate whether it has positive deviation or negative deviation from the ideal solution.
The Ptotal for the values given in the graph is found out and plotted in the graph.
ptotal(mm Hg) | 632.8 | 603.0 | 579.5 | 562.1 | 580.4 | 599.5 | 615.3 | 641.8 |
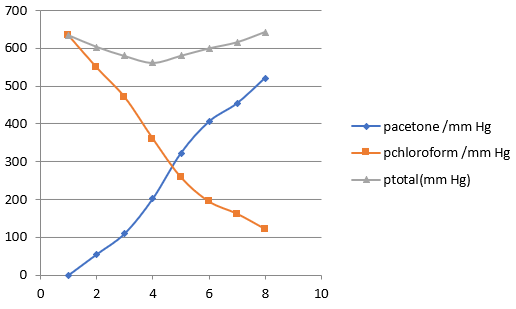
It can be observed from the graph that the plot for the p total of the solution curves downwards. Therefore, the solution shows negative deviation from the ideal behaviour.