What are the average fixed cost, average variable cost and average cost of a firm? How are they related?
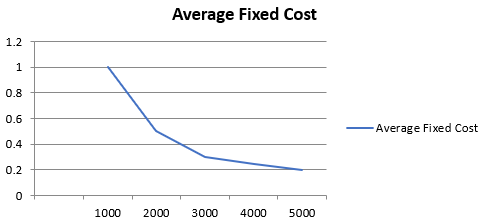
Average fixed cost is per unit cost on fixed factors, it decreases with increase in output.
Average fixed cost = Total Fixed Cost / No. of Units Produced
Cost Schedule
Total Output | Total Fixed Cost | Average Fixed Cost |
1000 2000 3000 4000 5000 | 1000 1000 1000 1000 1000 | 1 0.5 0.3 0.25 0.20 |
Graph
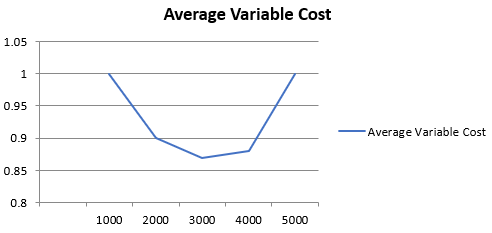
Average variable cost is per unit cost of variable factors it remains constant.
Average variable cost = Total Variable Cost / No. of Units Produced
Cost Schedule
Total Output | Total Variable Cost | Average Fixed Cost |
1000 2000 3000 4000 5000 | 1000 1800 2600 3500 5000 | 1 0.9 0.87 0.88 1 |
Graph
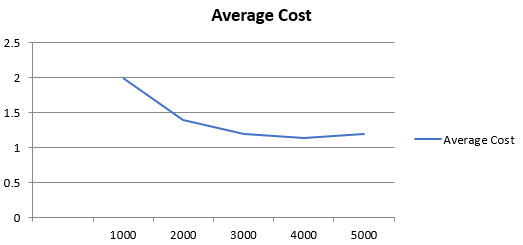
Average total cost means total cost per unit of output it is a u shaped curve like average variable cost. The average fixed cost is represented by a rectangular hyperbola
Average total cost = Total Cost / No. of Units Produced
Cost Schedule
Total Output | Total Cost | Average Cost |
1000 2000 3000 4000 5000 | 2000 2800 3600 4500 6000 | 2 1.4 1.2 1.13 1.2 |
Graph
Relationship between Average Fixed Cost, Average Variable Cost, and Average Cost -
• Average fixed cost curve is rectangular hyperbola.
• It falls continuously to the right but will never touch the x-axis because average fixed cost can never be zero.
• Average variable cost and average total cost or average cost curve is U shaped.
• Average cost curve lies above average variable cost curve and as output increases the vertical difference between two curves will decrease but they will never intersect.