What does the average fixed cost curve look like? Why does it look so?
Average fixed cost curve looks like a rectangular hyperbola. The average fixed cost is total fixed cost divided by the output. As we know that total fixed cost remains same so as the output will increase the average fixed cost will decrease.
At low level of output, that is something near 0 the average fixed cost will be very high as compared to the average fixed cost at maximum level of output. However it never become zero because fixed cost is never 0, so it is like a rectangular hyperbola and never intersects the x axis.
The following schedule and graph will help to understand
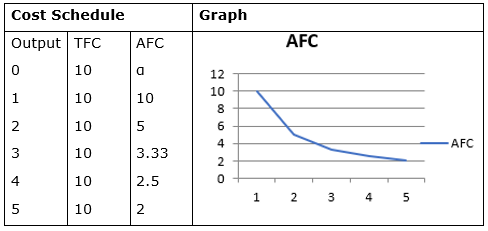
TFC – Total Fixed Cost
AFC – Average Fixed Cost = Total Fixed Cost / output
16