Explain through a diagram the effect of a rightward shift of both the demand and supply curves on equilibrium price and quantity.
The effect of rightward shift of both demand and supply curve on equilibrium price and quantity can be explained in following three manners –
1. Where demand and supply increase in same proportion - In this case the equilibrium price will remain unchanged.
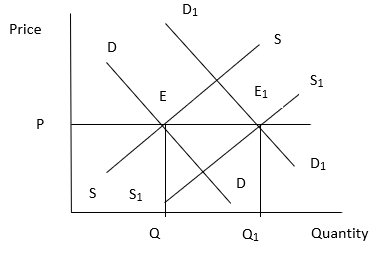
In the given graph the original demand curve shifts from DD to D1D1 and supply curve from SS to S1 S1 due to which the equilibrium point shifts from E to E1 but the equilibrium price is same i.e. P.
2. Where demand increases more than the increase in supply - In this case the equilibrium price will rise.

In the given graph the original demand curve shifts from DD to D1D1 and supply curve from SS to S1 S1. The increase in demand curve is more than that in the supply curve due to which the equilibrium point shifts from E to E1 which increases the equilibrium price to P1.
3. Where demand increases less than the increase in supply - In this case the equilibrium price will fall.

In the given graph the original demand curve shifts from DD to D1D1 and supply curve from SS to S1 S1. The increase in supply curve is more than that in the demand curve due to which the equilibrium point shifts from E to E1 which decreases the equilibrium price to P1.