Sketch the graph of y = |x+3| and evaluate 
It is given that y = |x + 3|
The value of x and y are given in the following table:
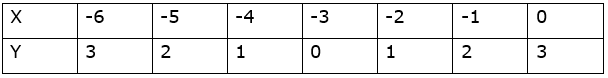
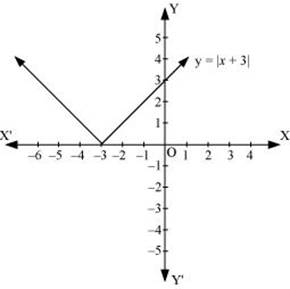
By plotting these points, we get the graph of y = |x+3| as below:
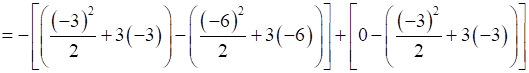
We know that, (x + 3) ≤ 0 for -6 ≤ x ≤ -3 and (x + 3) ≥ 0 for -3 ≤ x ≤ 0
Thus, 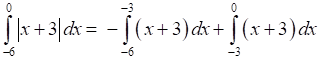
⇒ 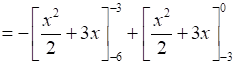
⇒ 
⇒ 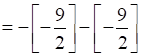
= 9
6