The velocity-time graph of a particle in one-dimensional motion is shown in Fig. 3.29:
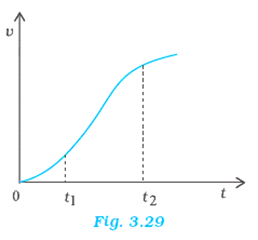
Which of the following formulae are correct for describing the motion of the particle over the time-interval t 1 to t 2:
(a) x(t2 ) = x(t1) + v (t1) (t2 – t1) +(1/2) a (t2 – t1)2
(b) v(t2 ) = v(t1) + a (t2 – t1)
(c) vaverage = (x(t2) – x(t1))/(t2 – t1)
(d) aaverage = (v(t2) – v(t1))/(t2 – t1)
(e) x(t2 ) = x(t1) + vaverage (t2 – t1) + (1/2) aaverage (t2 – t1)2
(f) x(t2 ) – x(t1) = area under the v-t curve bounded by the t-axis and the dotted line shown.
It is clear from the given graph that slope is not linearly varying. All linear equations in the given equations will cancel out and remaining equations may cause the above graph.
Thus,
Equations (a), (b) and (e) are wrong formulae.
Equations (c), (d) and (f) are correct formulae.