Solve the following system of linear equations graphically:
2x - y = 1, x - y = -1.
Shade the region bounded by these lines and the y-axis.
Equation 1:
2x - y = 1
X | 0 | 1 |
Y | -1 | 1 |
Plot the line with equation 1 on graph.
Equation 2:
x - y = -1
X | 0 | - 1 |
Y | 1 | 0 |
Plot the line with equation 2 on graph.
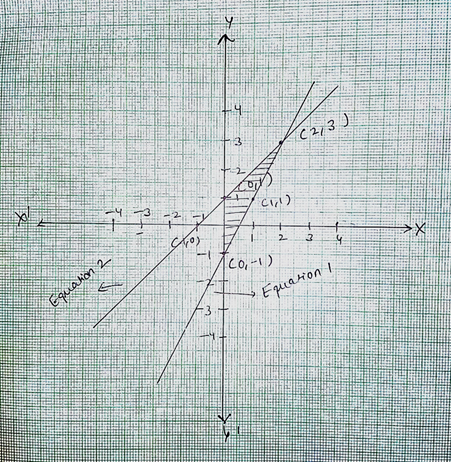
From the graph We observe point of intersection of two lines is (2, 3)
Region bound by these lines and y-axis is shaded in the graph.
29