The following table gives the yield per hectare of wheat of 100 farms of a village:
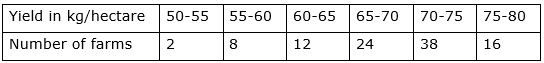
Change the above distribution to 'more than type' distribution and draw its ogive.
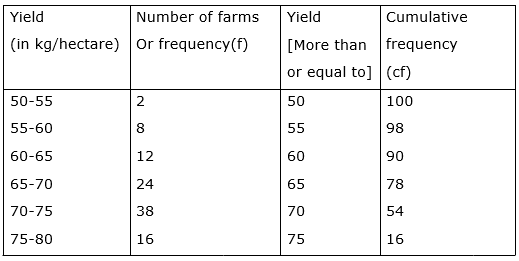
Let us draw cumulative frequency with table for the above data
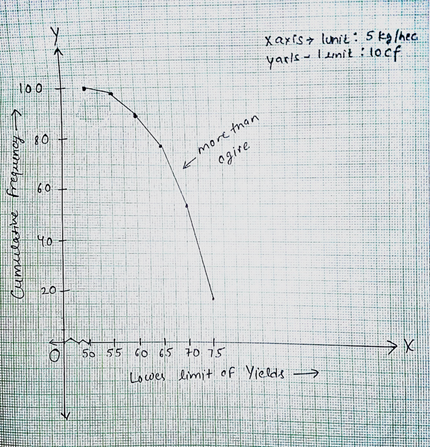
Taking Yield as x-axis and Cumulative frequencies as y-axis, we draw its more than 'ogive'
30