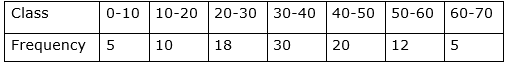
Find the mean, mode and median of the following data:
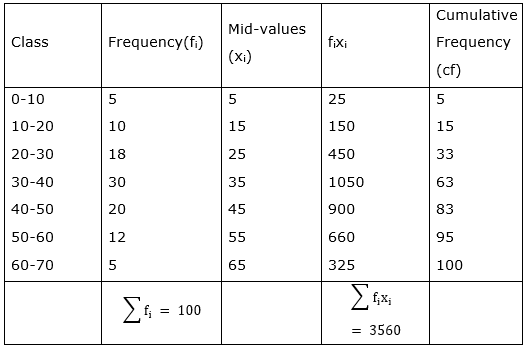
Let us make the table for above data and containing cumulative frequency and mid-values for each data
MEAN
We know, that
![]()
![]()
![]()
MODE
In the given data,
The maximum class frequency is 30. So, the modal class is 30-40.
Lower limit(l) of modal class = 30
Class size(h) = 40 - 30 = 10
Frequency(f1) of modal class = 30
Frequency(f0) of class preceding the modal class = 18
Frequency(f2) of class succeeding the modal class = 20
And we know,
![]()
Substituting values, we get
![]()
![]()
MEDIAN
In this case,
Sum of all frequencies, n = 100
![]()
Now, we know the median class is whose cumulative frequency is greater than and nearest to ![]() .
.
As, Cumulative frequency greater than and nearest to 50 is 63, the median class is 30 - 40.
Median ![]()
where l = lower limit of median class,
n = number of observations,
cf = cumulative frequency of class preceding the median class,
f = frequency of median class,
h = class size
In this case,
l = 30
n = 100
cf = 33
f = 30
h = 10
Putting values, we get,
Median ![]()
![]()