The following table gives the growth chart of a child.
![]()
Draw a line graph for the table and answer the questions that follow.
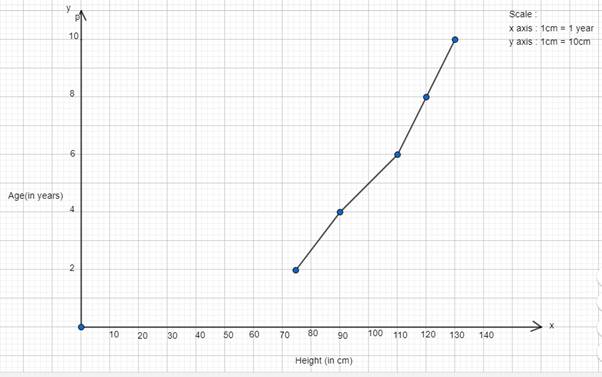
A) What is the height at the age of 5 years?
B) How much taller was the child at the age of 10 than at the age of 6?
C) Between which two consecutive periods did the child grow more faster?
A) From the given graph , we can say that , the height at the age of 5 years is 100cm.
B) From the given graph , we can say that , the height of the child at the age of 6 years is 110cm, and the height of the child at the age of 10 years is 130cm.
∴ we can say that the child of age 10 years is taller by 20cm from the child at the age of 6 years.
C) From the given graph , we can say that , between 2 and 4 years the growth in height of the child is of 15cm and between 2 and 4 years the growth in height of the child is of 20cm , so we can say that the 2 consecutive periods between which the child grow more faster were 2-4years and 4-6 years.