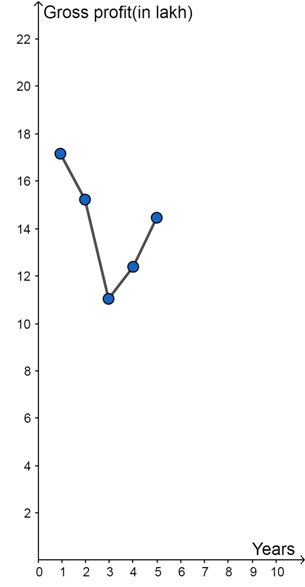
Draw the graph using suitable scale to show the annual gross profit of a company for a period of five years.
![]()
Let us take years on X axis and gross profit on Y axis.
The line graph is shown below for the annual gross profit of a company for a period of five years.
73