Create a table like the one shown

If an estimate is the same as the actual measurement then the point (actual measurement, estimate) lies on the line, straight line p. For example, if an object measures 5 cm and you estimate it to 5 cm, then the graph of its point lies on line p in the figure below.

Using your completed table,
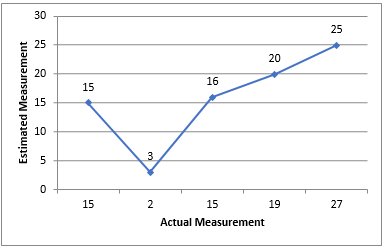
A. Plot the data from the table where the coordinates of the points are (measurement, estimate).
B. Identify the objects overestimated.
C. Identify the objects underestimated.
D. By looking at the graph, how can overestimates and underestimates be determined? How accurate is your estimation?

A.
B.
Overestimated objects are:
a) EraserZ
b) Palm
c) Geometry box
C.
Underestimated objects are:
a) Math Notebook
D.
When the estimated measurements are more than actual measurements, then it can be said we have Overestimated our data.
When the estimated measurements are less than actual measurements, then it can be said we have Underestimated our data.
We able to determine only one observation accurately, that is, length of a pen.