Given below are the seats won by different political parties in the polling outcome ofa state assembly elections:
Political Party | A | B | C | D | E | F |
Seats Won | 75 | 55 | 37 | 29 | 10 | 37 |
(i) Draw a bar graph to represent the polling results.
(ii) Which political party won the maximum number of seats?
The parts of the questions are solved below:
(i) The given polling results are represented by the bar graph below:
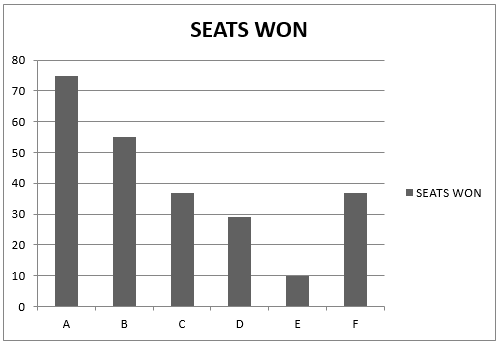
(ii) The party named A has won the maximum number of seats.
21