The length of 40 leaves of a plant are measured correct to one millimetre, and the obtained data is represented in the following table:
Length (in mm) | Number of leaves |
118 - 126 127 - 135 136 - 144 145 - 153 154 - 162 163 - 171 172 - 180 | 3 5 9 12 5 4 2 |
(i) Draw a histogram to represent the given data.
(ii) Is there any other suitable graphical representation for the same data?
(iii) Is it correct to conclude that the maximum number of leave are 153 mm long? Why?
The parts of the questions are solved below:
(i) The data is represented in a discontinuous class interval. So, at first we will make it continuous.
The difference is 1.
So, we subtract � = 0.5 from the lower limit and add 0.5 to the upper limit.
S.No. | Length (in mm) | Number of Leaves |
1. | 117.5-126.5 | 3 |
2. | 126.5-135.5 | 5 |
3. | 135.5-144.5 | 9 |
4. | 144.5-153.5 | 12 |
5. | 153.5-162.5 | 5 |
6. | 162.5-171.5 | 4 |
7. | 171.5-180.5 | 2 |
Now, the above information is represented by the histogram below:
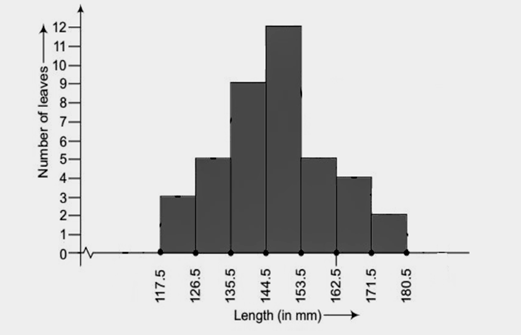
(ii) Yes, the above given data can also be represented by the frequency polygon.
(iii) No, it is incorrect to conclude that the maximum number of leaves are lying between length of 144.5 – 153.5