The runs scored by two teams A and B on the first 60 balls in a cricket match are given below:
Number of balls | Team A | Team B |
1 – 6 7 - 12 13 - 18 19 - 24 25 - 30 31 - 36 37 - 42 43 - 48 49 - 54 55 - 60 | 2 1 8 9 4 5 6 10 6 2 | 5 6 2 10 5 6 3 4 8 10 |
Represent the data of both the teams on the same graph by frequency polygons.
[Hint: First make the class intervals continuous.]
The data is represented in a discontinuous class interval. So, at first, we will make it continuous.
The difference is 1.
Hence, we subtract μ = 0.5 from the lower limit and add 0.5 to the upper limit.
NUMBER OF BALLS | TEAM A | TEAM B |
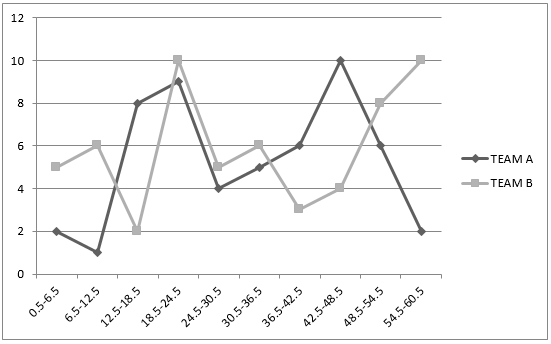
0.5-6.5 | 2 | 5 |
6.5-12.5 | 1 | 6 |
12.5-18.5 | 8 | 2 |
18.5-24.5 | 9 | 10 |
24.5-30.5 | 4 | 5 |
30.5-36.5 | 5 | 6 |
36.5-42.5 | 6 | 3 |
42.5-48.5 | 10 | 4 |
48.5-54.5 | 6 | 8 |
54.5-60.5 | 2 | 10 |
Now,
We will draw frequency polygon for the given data:
25