A random survey of the number of children of various age groups playing in a parkwas found as follows:
Age (in years) | Number of children |
1 - 2 2 - 3 3 - 5 5 – 7 7 - 10 10 - 15 15 - 17 | 5 3 6 12 9 10 4 |
Draw a histogram to represent the data above.
The class interval in the data is having varying width.
We know that the area of the rectangle is proportional to the frequencies in the histogram.
The class interval with minimum class size 1 is selected and the length of the rectangle is proportional to it.
Age (in years) | No. of children (Frequency) | Width of class | Length of rectangle |
1-2 | 5 | 1 |
|
2-3 | 3 | 1 |
|
3-5 | 6 | 2 |
|
5-7 | 12 | 2 |
|
7-10 | 9 | 3 |
|
10-15 | 10 | 5 |
|
15-17 | 4 | 2 |
|
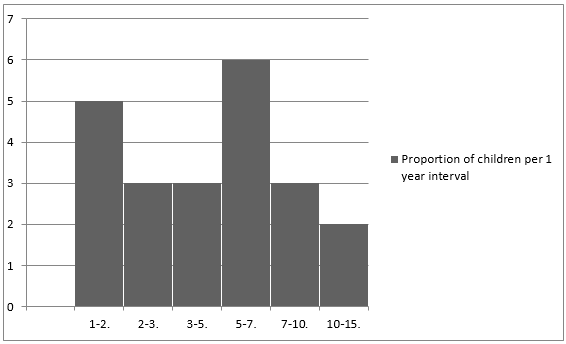
Taking the age of the children on x-axis and proportion of children per 1 year interval on y-axis, the following histogram can be drawn:
28