100 surnames were randomly picked up from a local telephone directory and a frequency distribution of the number of letters in the English alphabet in the surnames was found as follows:
10. Number of letters | 11. Number of surnames |
12. 1 – 4 13. 4 - 6 14. 6 - 8 15. 8 - 12 16. 12 - 20 | 17. 6 18. 30 19. 44 20. 16 21. 4 |
(i) Draw a histogram to depict the given information.
(ii) Write the class interval in which the maximum number of surname lie
The class interval in the data is having varying width.
(i) We know that the area of the rectangle is proportional to the frequencies in the histogram.
The class interval with minimum class size 2 is selected and the length of the rectangle is proportional to it. The proportion of the surnames per 2 letters interval can be calculated as:
Number of letters | No. of surnames (Frequency) | Width of class | Length of rectangle |
1-4 | 6 | 3 |
|
4-6 | 30 | 2 |
|
6-8 | 44 | 2 |
|
8-12 | 16 | 4 |
|
12-20 | 4 | 8 |
|
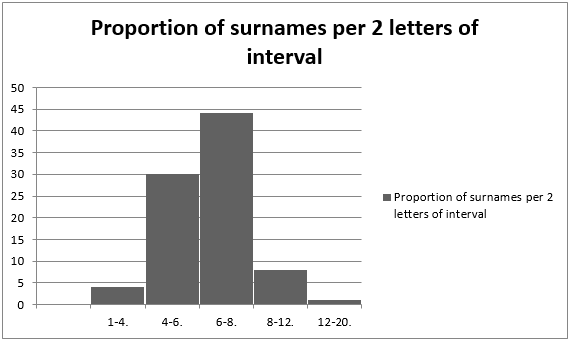
(ii) The class interval in which the maximum number of surname lie is 6-8