What do you understand by displacement-time graph? Draw a displacement-time graph for a girl going to school with uniform velocity. How can we calculate uniform velocity from it?
Displacement – Time graph is a plot of points telling the position of particles at that instant of time.
Y – Axis : Displacement
X – Axis : Time
We plot the points for different positions of particle at different times.
Slope of displacement – time graph gives the velocity.
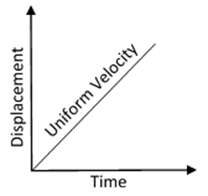
Consider an example of a girl going to school with uniform velocity.
Uniform velocity means equal displacement in equal intervals of time. Thus for uniform velocity the graph of displacement against time will be straight line as shown below:
To calculate uniform velocity from the graph,
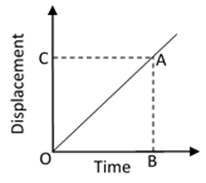
The slope of displacement – time graph indicates velocity of the body. So, the slope of the displacement – time graph can be used to calculate the velocity of the body.
For calculating the slope of the displacement – time graph, we take a point A on the straight line graph and drop a perpendicular AB on the time axis (x – axis).
AB = Distance travelled by the body
OB = Time interval
Now, Velocity = ![]()
Velocity = ![]()
Where ![]() is the slope of line OA
is the slope of line OA
Hence, we calculate uniform velocity from the displacement – time graph.